Want to know more?
Contact us for more information about what IQR Web Visualization can do for your bussiness.
+46 520-48 58 83
IQR Web Visualization
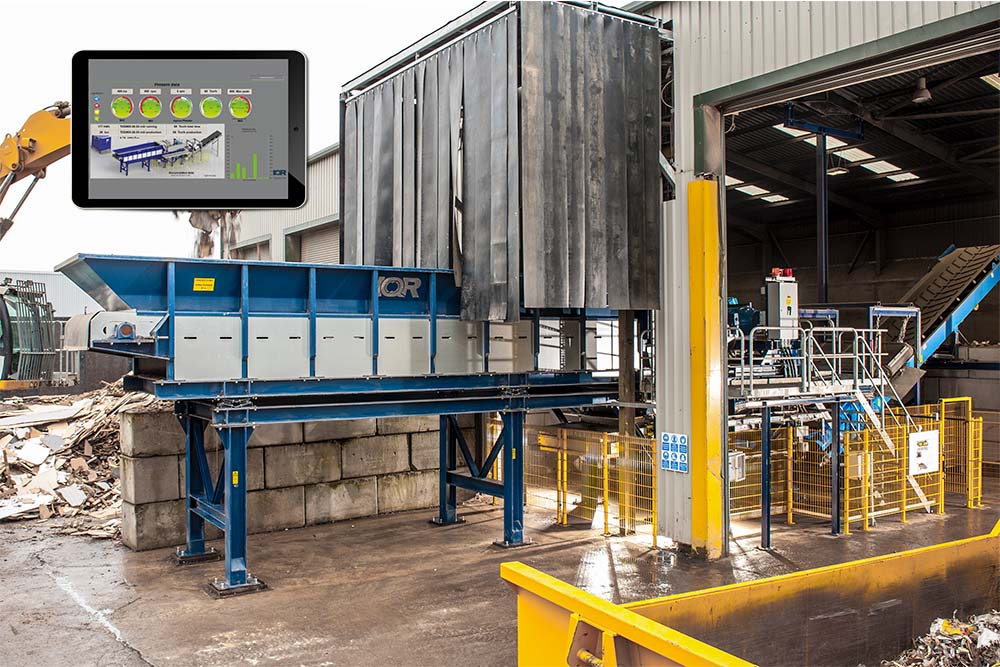
We are very pleased to be able to deliver as an option to our machines this solution where you can follow the production in real time via a secure website.
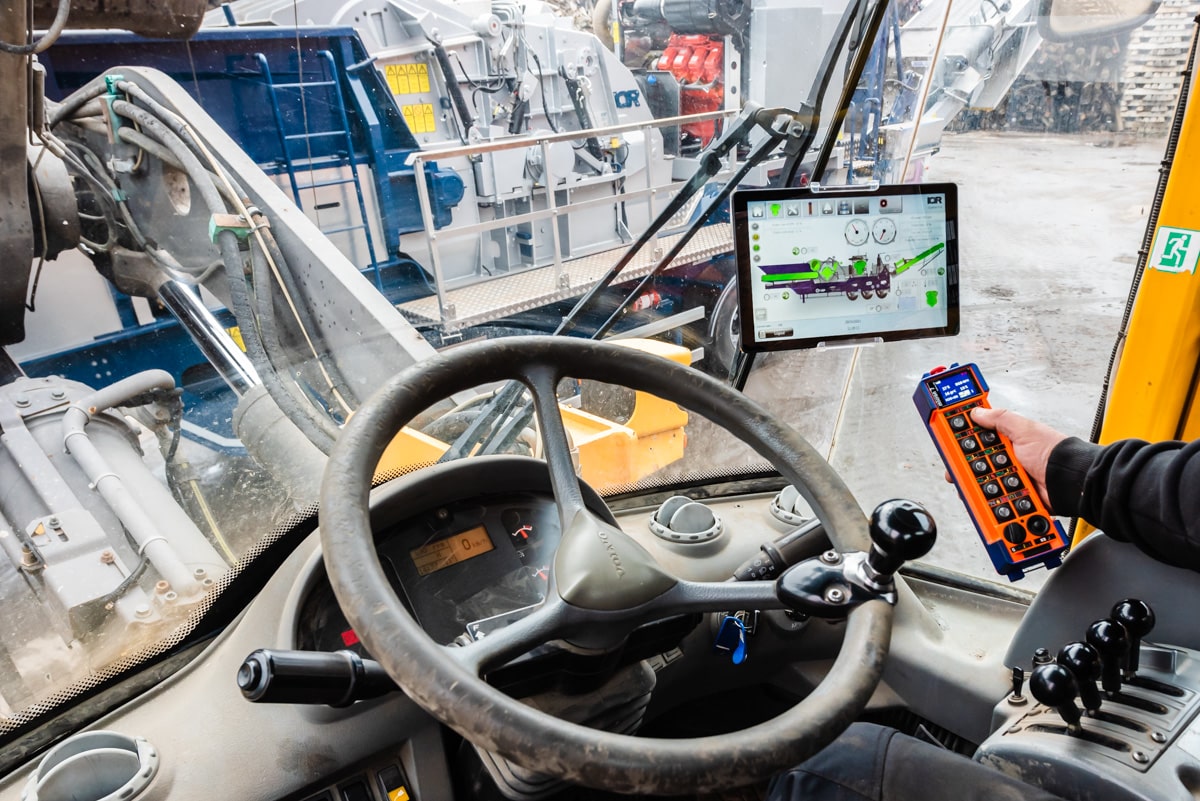
You can easily access your information from the comfort of your home either on a big screen TV, on a tablet or via your mobile phone. All that is required is an internet-connection, login, and browser.
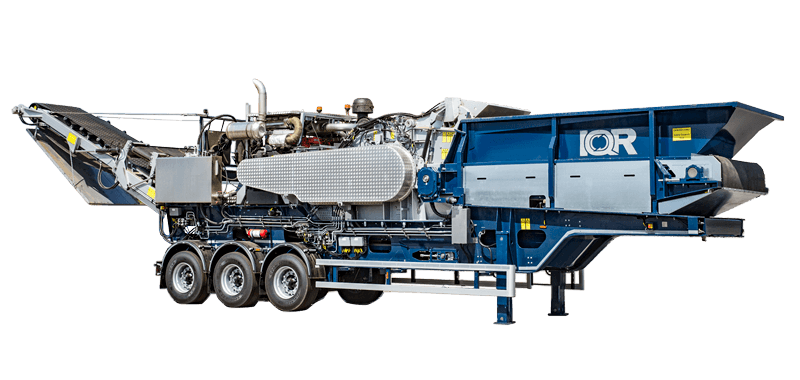
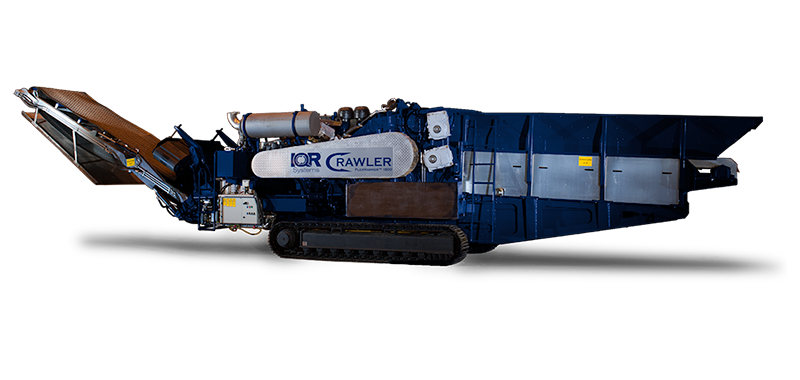
IQR Web Visualization is available for both mobile and static crushers.
What information is displayed?
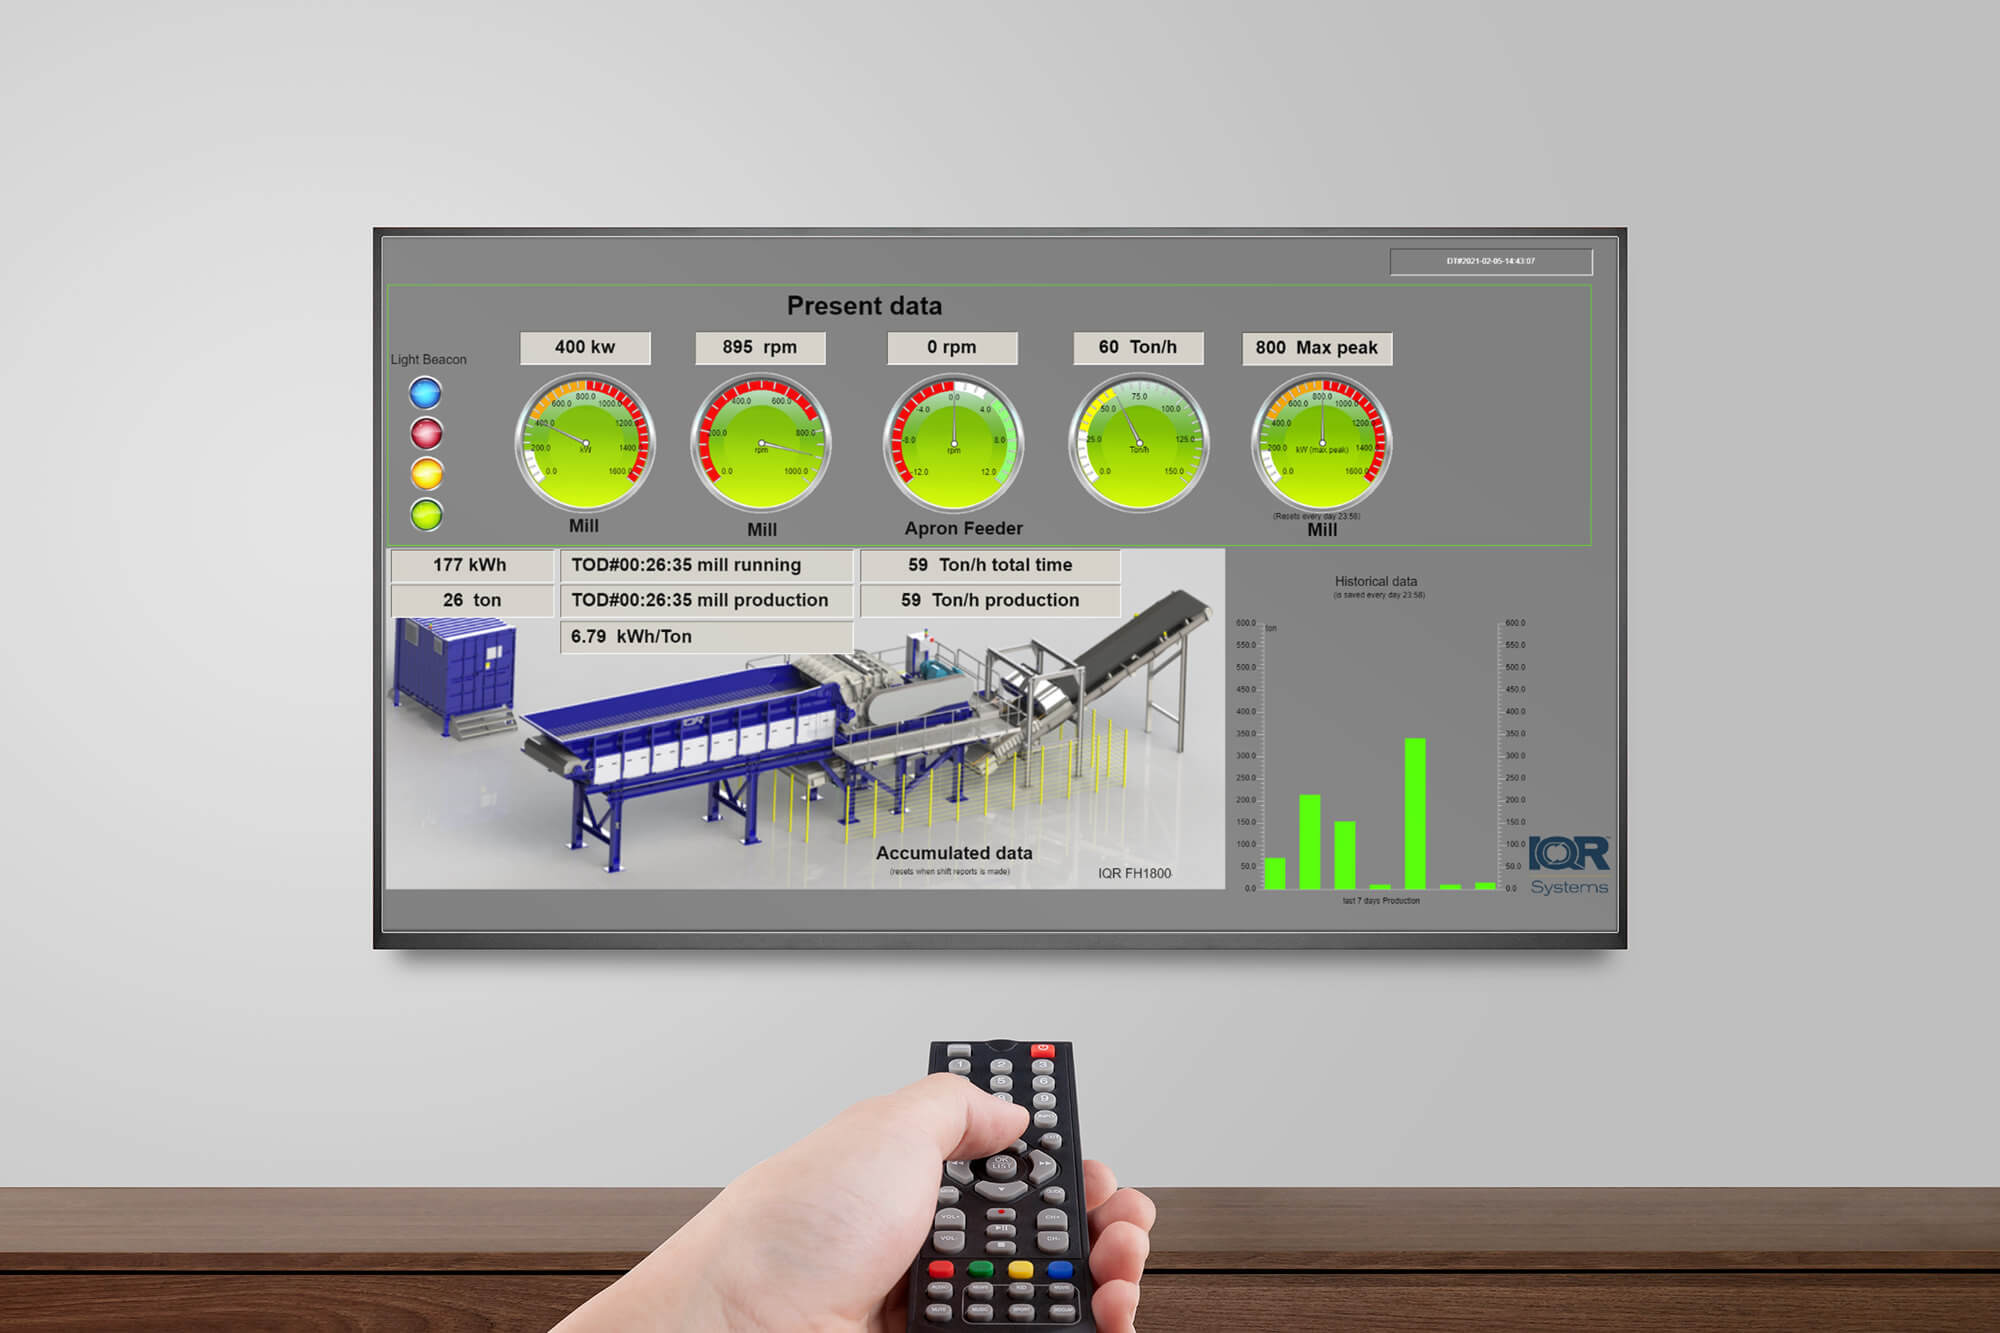
The page provides information about current performance but also accumulated values such as tons/h or kWh/ton, historical data over the last 7 days is also displayed as a bar chart.
Accumulated data
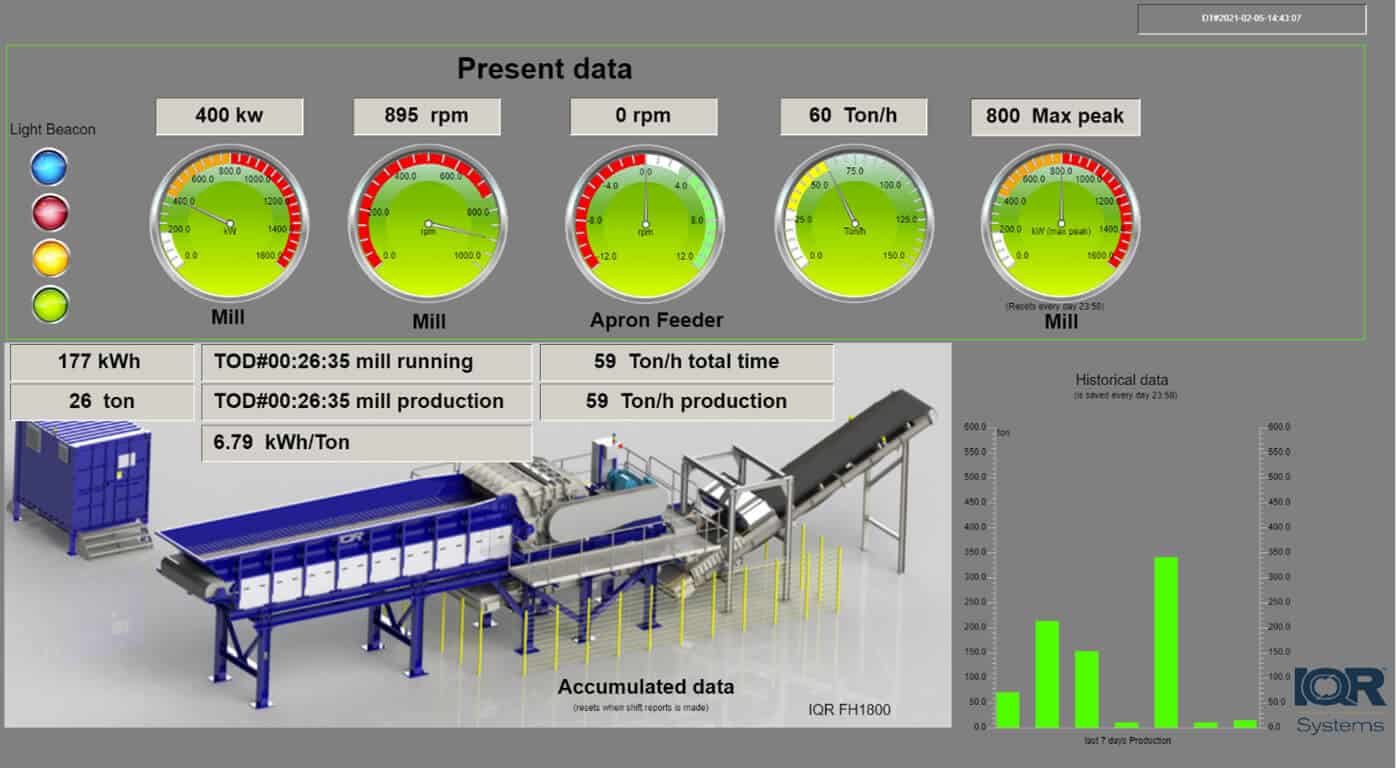
Accumulated data shows the output in total. Values in these fields are reset when the shift report is generated from the HMI. To get the most out of this website, it assumes that the machine has a scale installed. From these boxes you can read the total tons that have been crushed and kWh consumed. You can also see the time the machine has been loaded with material versus idling. Average tons/h for the time the mill have been loaded but also the average capacity of the total time that the mill has been active/under load. These information fields are a complement to our reporting system which, via the HMI screen generates production reports and trend reports.
Light beacon
The light beacon shows the same signals as on the machine so by reading the operator’s manual and getting acquainted with what the different color combinations means you can interpret if the machine is running optimally or if adjustments should be made.
Present data
With these meters/fields you get see data such as:
- Motor consumption kW.
- Rotor speed.
- Input speed.
- Tons/h – average right now (updates every 30 s)
- Highest current peak.
History
(Historical data)
The last seven days of production is saved and displayed in a bar chart so that you can easily follow production (each bar shows 24 hours and is generated automatically).
Do you want to know more about IQRs Web Visualization?
Want to know more about how Web Visualization can make your business more efficient? Contact us for more information about IQR crushers and Web Visualization.
+46 520-48 58 83

